Numerical Investigation of the Thermospheric Sodium Layer
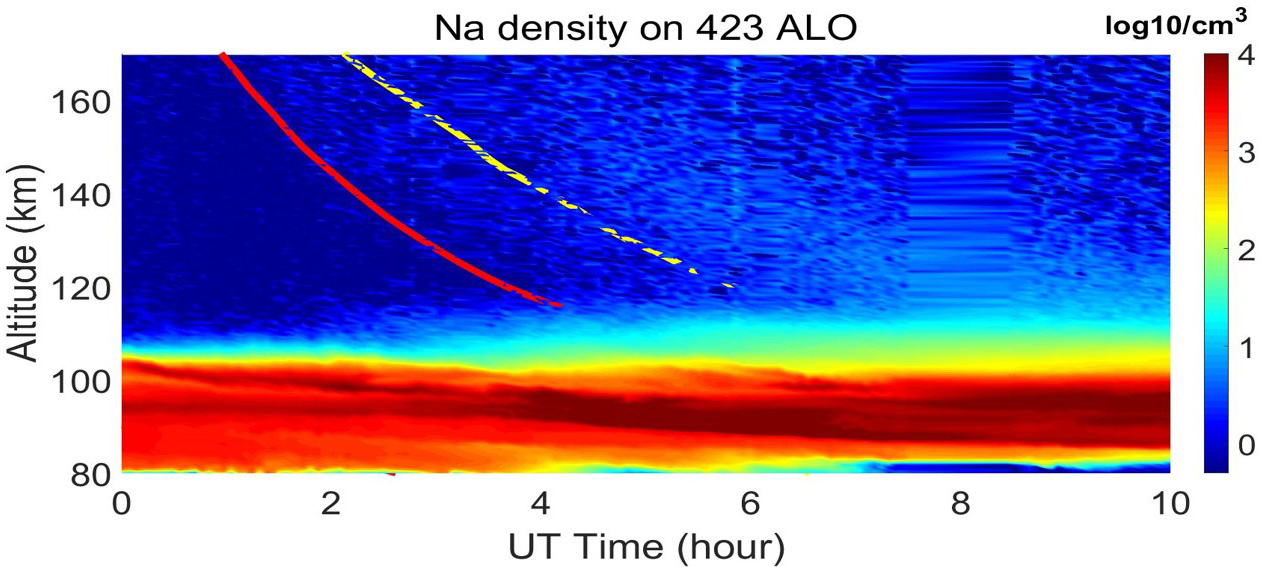
"The extension of neutral atomic Na layer into thermosphere (up to 170 km) has been observed in low and high latitudes recently by Na lidar while the geophysical mechanisms and implications of the formation are unknown. In this study, we conduct a numerical simulation on the variations of Na and Na+ in the low latitude E and F region, where the contributions from electromagnetic force, neutral wind, diffusion and gravity are included. The simulation suggests: First, as the major reservoir of atomic Na in the E region, Na+ in the subtropics region of the geomagnetic equator cannot be transported into thermosphere very high, ~ 200 km, due to the ambipolar diffusion caused by the relative motion of electron and ions. Second, this implicates that the fountain effect, which becomes dominant in the meridional transport only above 450 km, plays very little role of transporting Na+ to the both sides of geomagnetic equator in the E region. Third, the possible explanation for the frequent generation of the thermospheric sodium layer during spring equinox in Cerro Pachon, Chile is owing to the large vertical dynamic transport related to the tidal wave perturbations. However, the mechanism of such perturbation is still not clear at the moment."
Comparison of Reyleigh-Scatter and Sodium Resonance Lidar Temperatures
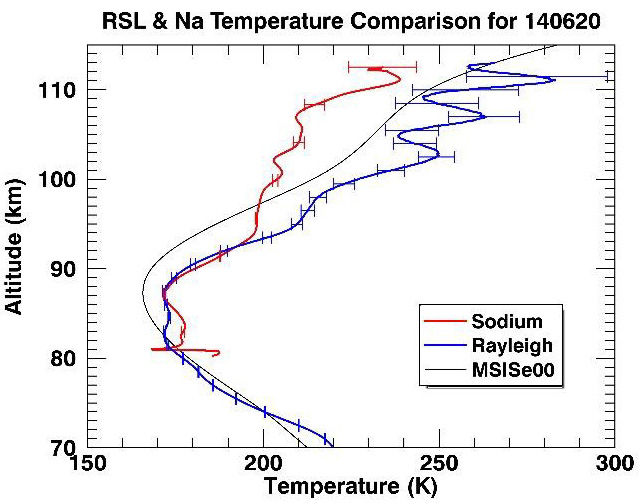
"We present an unprecedented comparison of temperature measurements from the Rayleigh-scatter (RS) and sodium (Na) lidar techniques. The extension of the RS technique into the lower thermosphere that has been achieved by the group at Utah State University (USU), enables simultaneous, common-volume measurements by the two lidar systems hosted in the Atmospheric Lidar Observatory at USU. The two lidars’ nightly averaged temperatures from 80-105 km, based on 19 nights of observations, are explored."
Wave Breaking Event
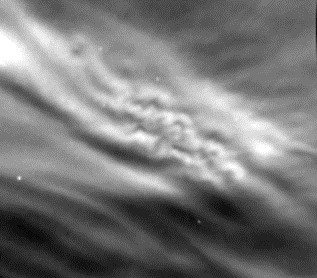
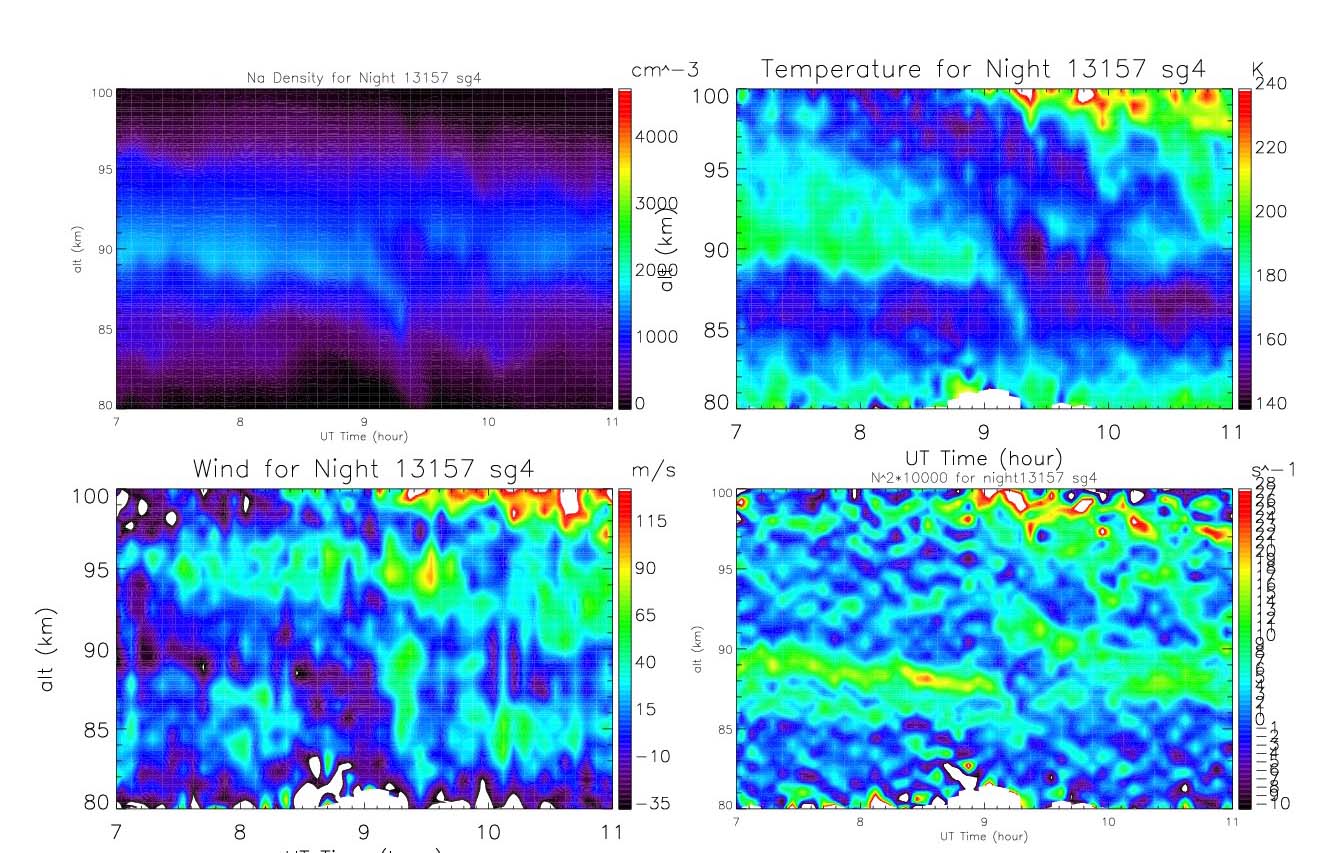
Dramatic wave breaking event observed by AMTM on June 6, 2013 on USU campus during a collaborative campaign with the USU Na lidar. The pictures are in the time sequence of 5-minute time sequence between UT 08:55 and 09:15. The coincident lidar temperature (top right) and zonal wind field are shown (bottom left).